Improving Public Transport Efficiency
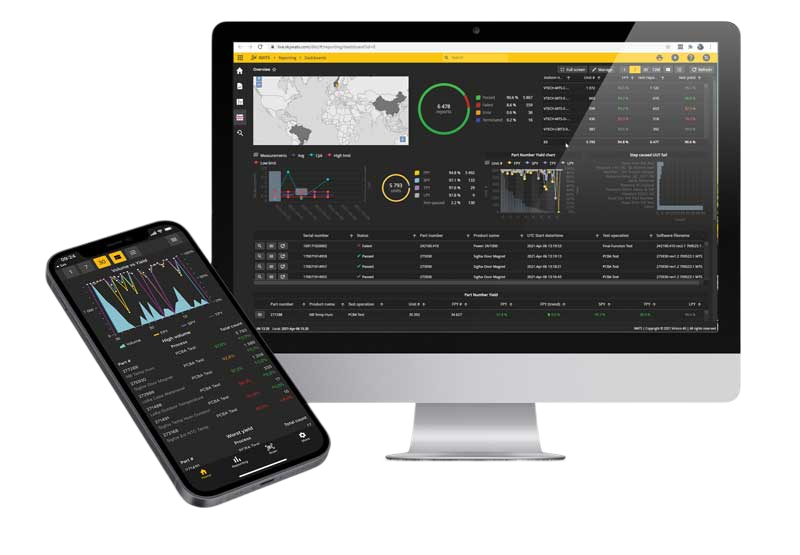
Real-Time Operations Dashboards

Client Context
Understanding the client’s operational landscape
Large Fleet Network
Client manages an extensive network of vehicles and routes across the region.
Service Reliability Focus
Leadership needed better visibility into fleet performance to maintain reliable service.
Static Reporting Challenge
Historical performance tracking relied on manual updates and static reports.
The Challenge
Operational inefficiencies were limiting service reliability and resource optimization
Scattered Data
Fleet usage and scheduling data were fragmented across multiple systems
No Central Dashboard
Lack of centralized visibility into real-time operations
Manual Reporting
Manual processes caused significant delays in decision-making
Limited Insights
Difficulty identifying underutilized vehicles and inefficient routes
Poor KPI Tracking
Limited ability to monitor operational efficiency metrics
Current State Metrics (Before Solution)
Reporting Cycle
Weekly
Instead of real-time
Data Quality
Fragmented
Inconsistent across systems
Route Optimization
None
No automated insights
Manual Work
High
Required for all reports
GWC's Solution
A comprehensive analytics solution designed for real-time operational excellence
Fleet Utilization Dashboards
Real-time tracking of vehicle usage across the entire network
Scheduling & Operations Views
Comprehensive insights into delays, route performance, and resource allocation
KPI Tracking
Monitoring key performance indicators like on-time performance and downtime
Executive Dashboards
High-level summaries with drill-down into route and vehicle-level metrics
Automation
Eliminated manual reporting through scheduled data refreshes
Solution Highlights
Real-time fleet monitoring and scheduling dashboards
Drill-down capabilities to analyze performance at route and vehicle level
Centralized dashboards for both operations managers and executives
KPI tracking for efficiency, reliability, and resource allocation
Automated refresh cycles for always up-to-date insights


Technology Stack

Domo
Dashboards & Visualization
Data Integration from Fleet Systems
ETL Tools
Data Cleaning & Automation Pipelines
Business Impact
Measurable improvements across operations, customer experience, and strategic positioning
Before vs. After
Reporting Cycle
Before
Weekly
After
Real-time
Near-instant insights
Fleet Utilization
Before
Suboptimal
After
Optimized
Reduced vehicle underuse
Scheduling Decisions
Before
Manual
After
Data-driven
Improved accuracy
Operational Impact
- •Reduced reporting cycle from weekly → near real-time
- •Improved fleet utilization and reduced underuse of vehicles
- •Better scheduling decisions with data-driven insights
Customer Impact
- •Increased service reliability with improved on-time performance
- •Improved resource allocation reduced delays
- •Enhanced passenger experience through better service
Strategic Impact
- •Established a data-driven decision-making culture in operations
- •Positioned Parisar as a modernized, efficiency-focused provider
- •Created foundation for continuous operational improvement
Key Transformation Achievement
Successfully transformed Parisar from a manually-tracked operation to a data-driven, real-time management system, establishing a foundation for continued operational excellence and customer service improvements.